- Home
- APPLICATIONS
- ROOM BUILDING ACOUSTICS
- REVERBERATION TIME
Reverberation Time
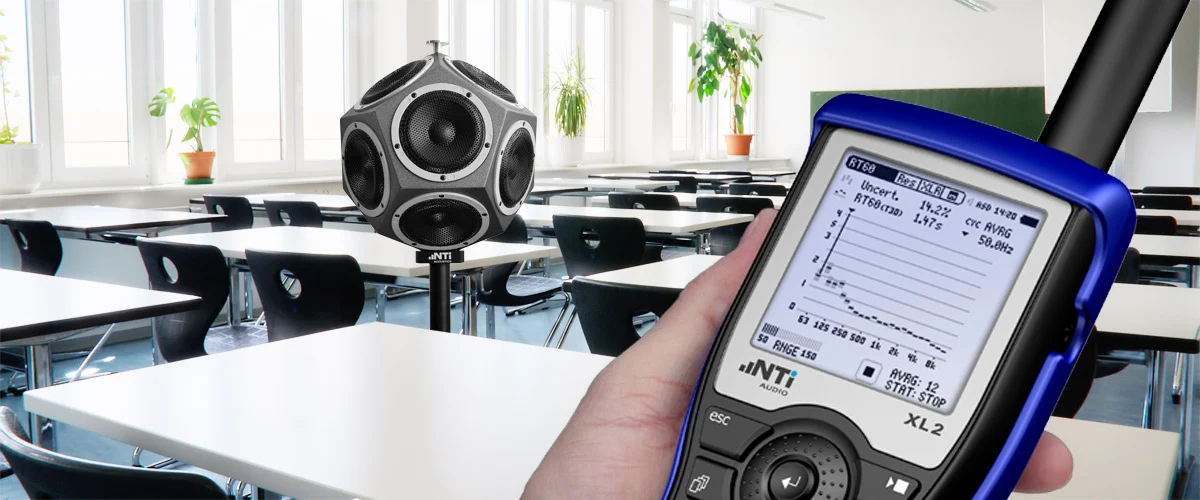
Reverberation is one of the most significant acoustic properties of a room. Knowing the reverberation time is essential in characterizing rooms, be they performance spaces, ordinary rooms or open office spaces.
While the requirements for measuring reverberation are described in detail in the ISO 3382 and ASTM E2235 standards, this page provides some basic common information such as terminology and how an actual reverberation time measurement is done.
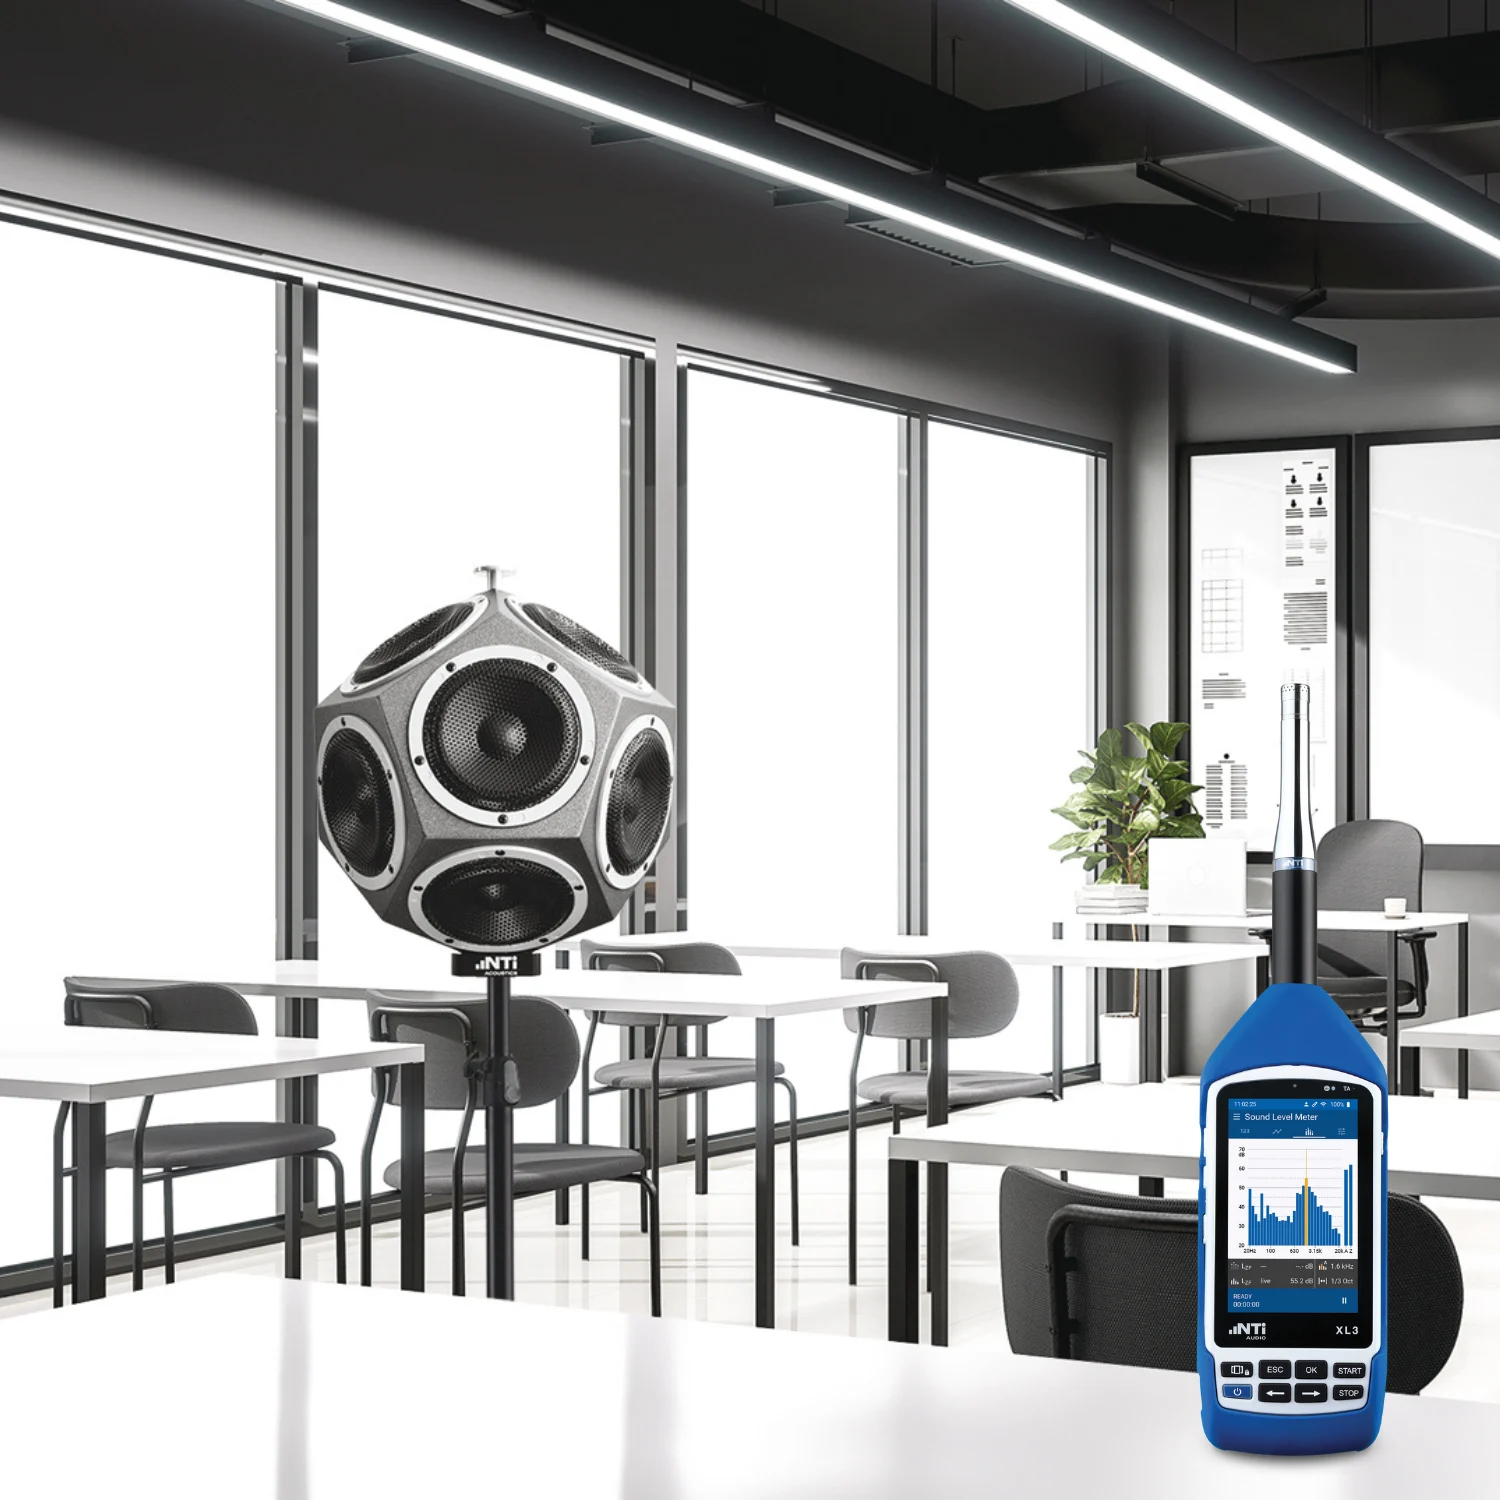
The Acoustic Analyzer in combination with the DS3 Dodecahedron Speaker Kit and the Room Acoustics Reporter software forms the professional reverberation time measurement solution.
What you need to know
What you need to measure Reverberation Time
- How to measure Reverberation Time
- Meter for Reverberation Time Measurement
- Sound Sources for Reverberation Time
- Producing Compliant Reports
What is Reverberation Time?
Sound produced in a room will repeatedly bounce off reflective surfaces such as the floor, walls, ceiling, windows or tables while gradually losing energy. When these reflections mix with each other, the phenomena known as reverberation is created. Reverberation is thus a collection of many reflections of sound.
Reverberation time is a measure of the time required for reflecting sound to “fade away” in an enclosed area after the source of the sound has stopped. It is important in defining how a room will respond to acoustic sound.
Get a feeling for reverberation times in various rooms, just by clapping your hands.
How is Reverberation Time defined?
The reverberation time measurement is defined in the ISO 3382-1 standard for performance spaces, the ISO 3382-2 standard for ordinary rooms, and the ASTM E2235 standard.
The reverberation time is the time the sound pressure level takes to decrease by 60 dB, after a sound source is abruptly switched off. Commonly-used abbreviation for Reverberation Time is RT60.
Reverberation Time values vary in different positions within a room. Therefore, an average reading is most often taken across the space being measured.
Rooms with a reverberation time of < 0.3 seconds are called acoustically “dead”. Typically, the reverberation time increases with the room volume. Smaller rooms with a reverberation time of > 2 seconds are commonly considered to be “echoic”.

Why is reverberation important?
Too much reverberation has a negative impact on the intelligibility of speech. This can, for example, make it hard to hear what a class teacher is saying.
Reverberation is also particularly noticeable in a place of worship where the sound may be heard for several seconds while it fades away. The main reason religious leaders pronounce their words clearly and talk slowly, leaving small gaps between sentences, is to overcome this reverberation and make their speech clear (such a manner of speaking also has a beneficial side-effect of sounding reverent).
Conference rooms are an especially challenging acoustic environment. Collaborative white boards, stylish glass walls and the obligatory large table are all highly-reflective surfaces for sound. This tends to increase the reverberation time of the room which impacts speech intelligibility.
Typically, reverberation times can be reduced by damping using absorbing materials such as thick carpets, curtains, upholstered furniture or dedicated sound-absorbing panels. Furthermore, the presence of people in a room reduces the reverberation, and therefore produces a lower reverberation time value compared to the unoccupied room.
On the other hand, too little reverberation will reduce the rich, warm acoustic sound from an orchestra in a concert hall.
How to measure Reverberation Time
This video explains how to measure reverberation time with the XL2 Audio Analyzer and the DS3 Dodecahedron Speaker Kit.
Step-by-step Procedure
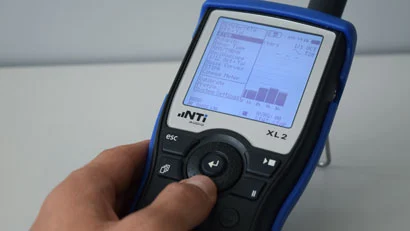
On the XL2, select RT60 from the main menu.
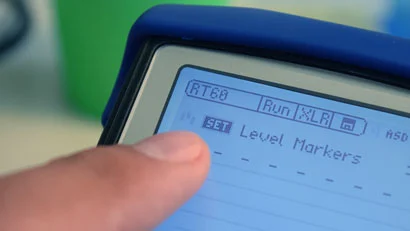
When the room is quiet, click SET.
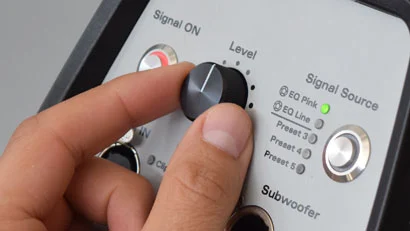
On the PA3, play “EQ Pink” noise and adjust the level.
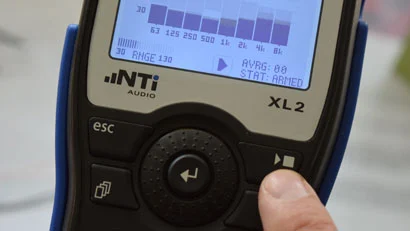
(wear hearing protection)Press the Start button on the XL2.
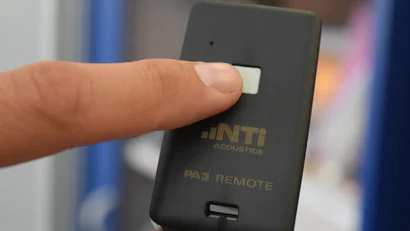
Toggle sound source 3 times on and off.
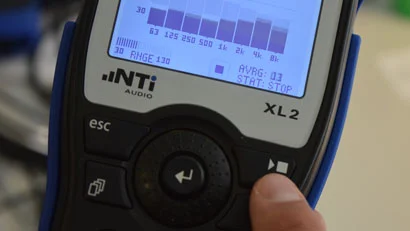
Press the Stop button on the XL2.
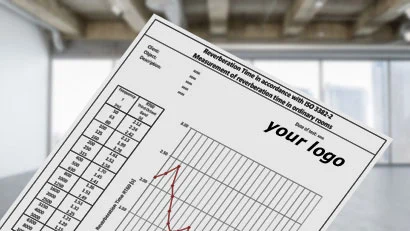
Print your Report.
Meter for Reverberation Time Measurement
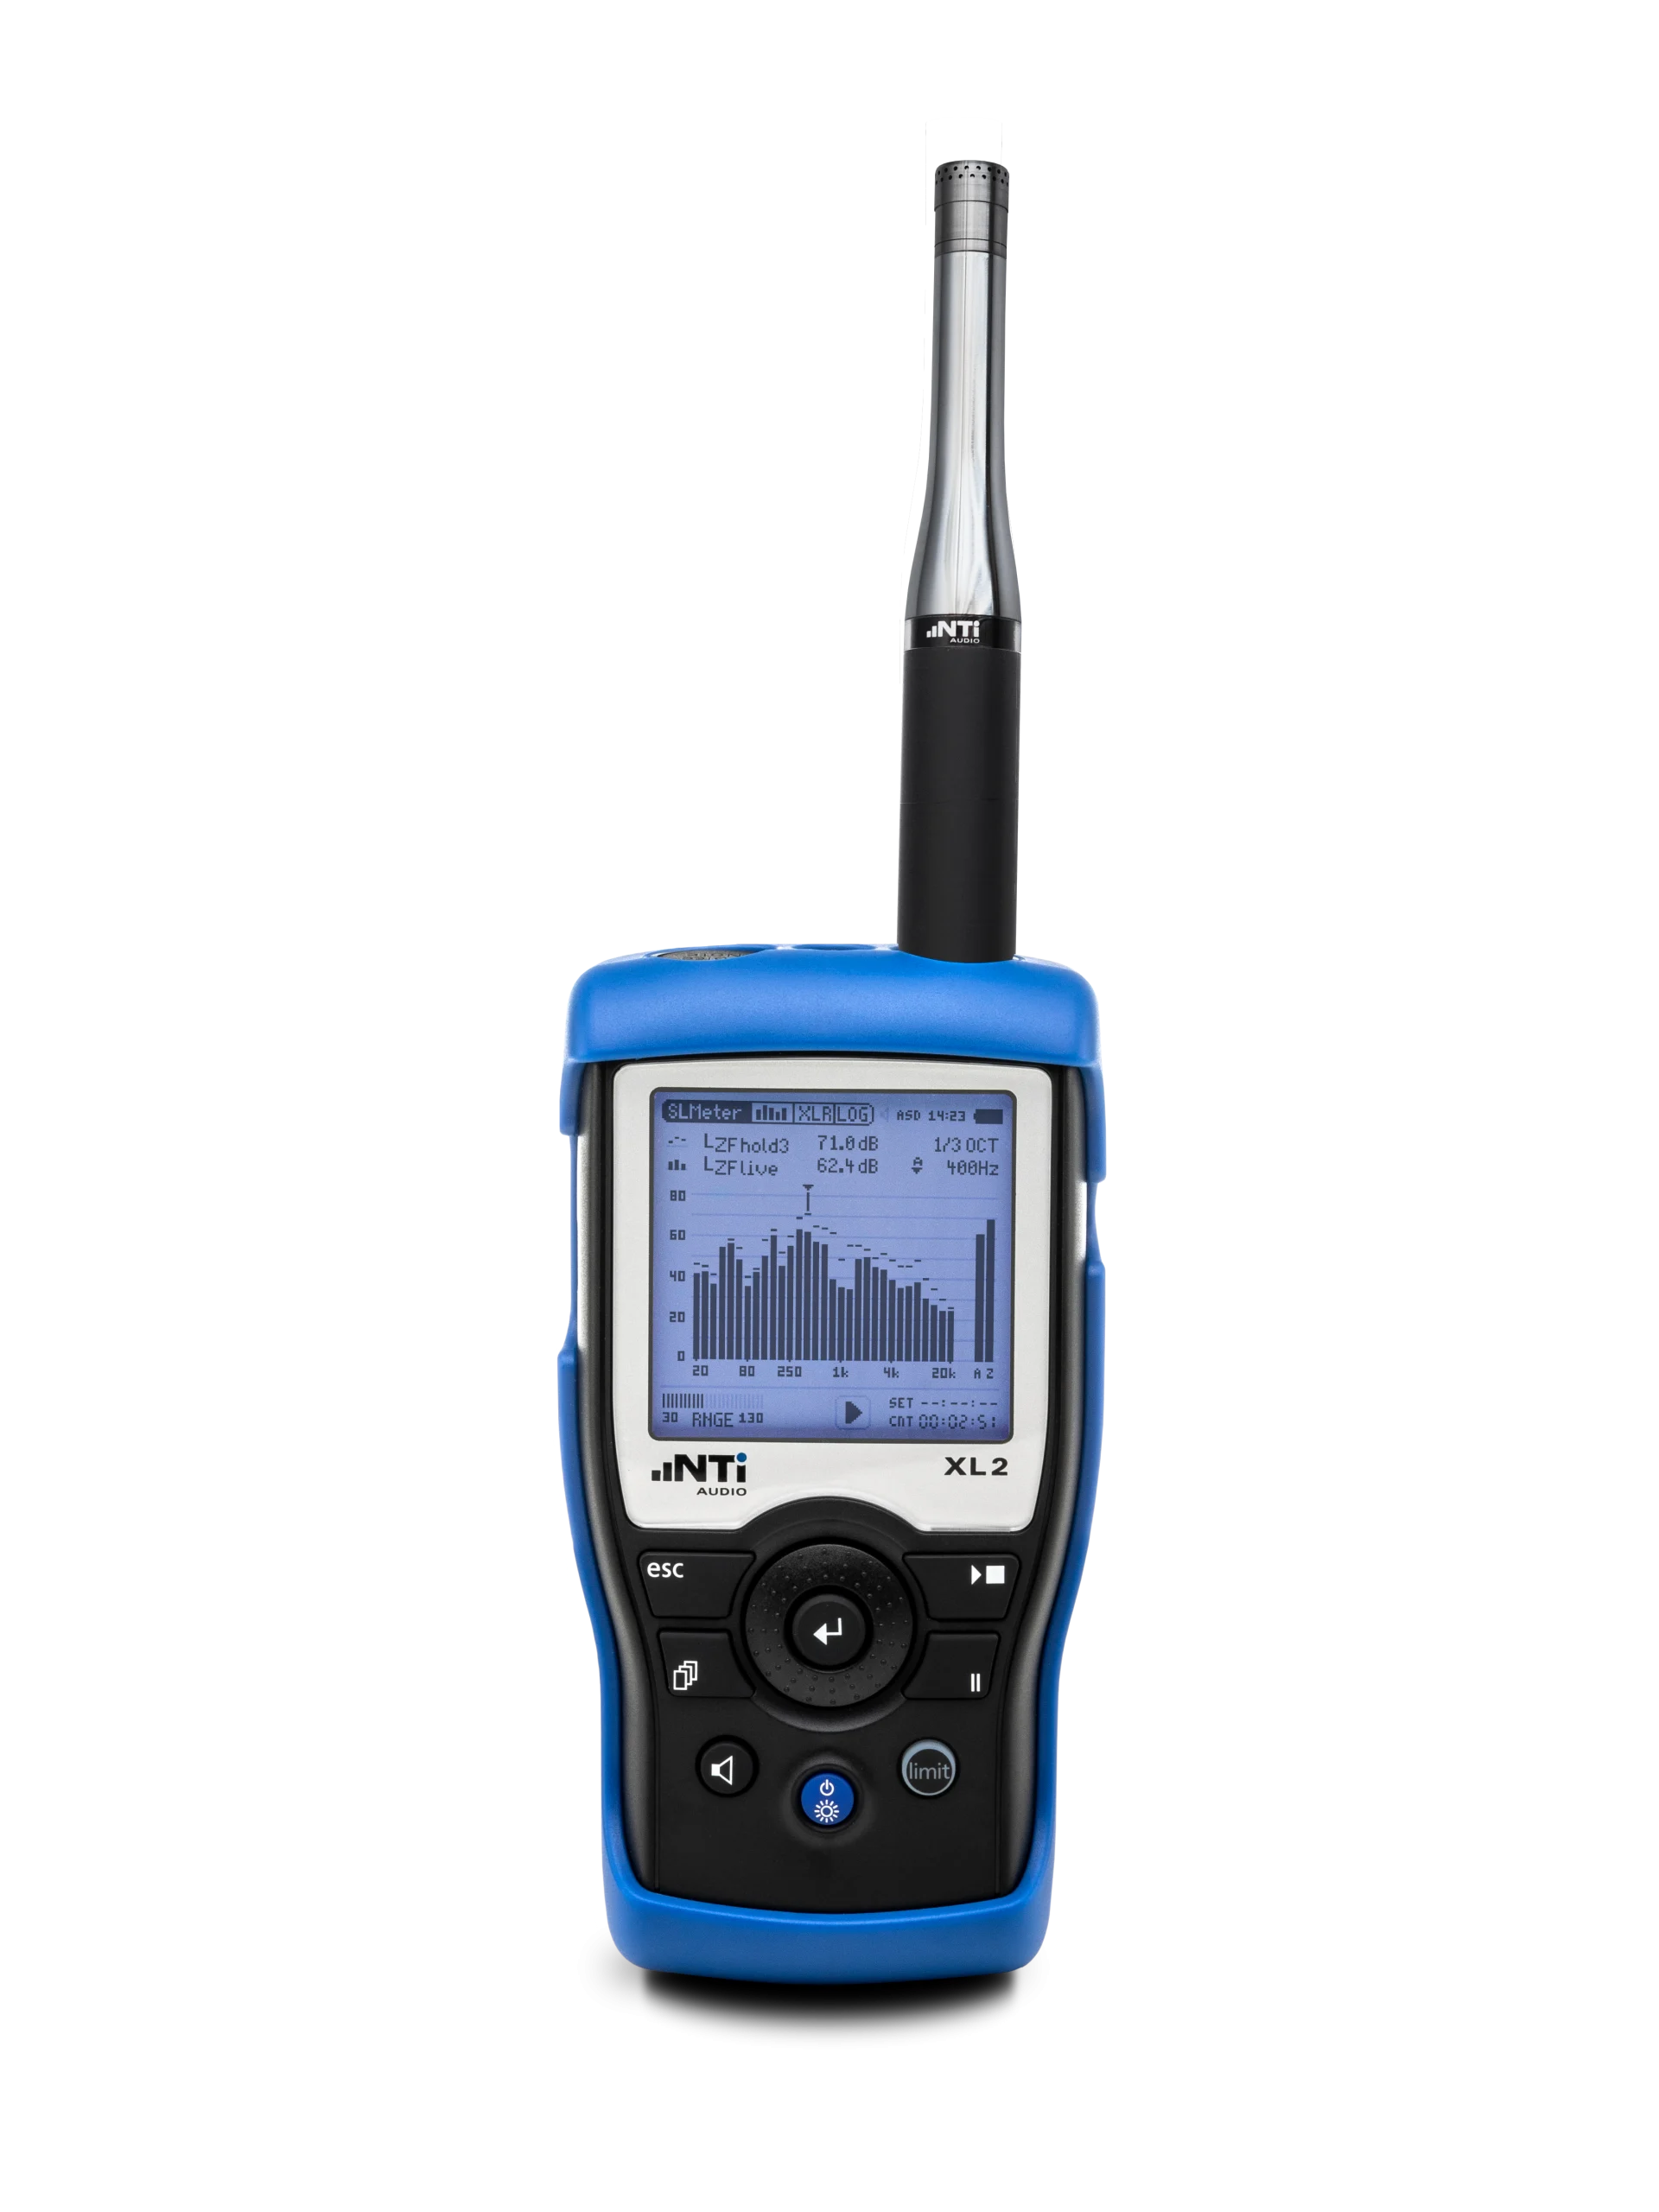
The XL2 Acoustic Analyzer measures the reverberation time automatically, thus minimizes the time and effort spent measuring. It stores all data onto the SD card for direct transfer to the computer for detailed data analysis and reporting.
Features
- automatic triggering on both impulse and gated noise sound sources
- automatic averaging of multiple measurements
- spectral results
- completely integrated documentation
- compliant to international standards

For consideration regarding the measurement meter
Correlation and Uncertainty
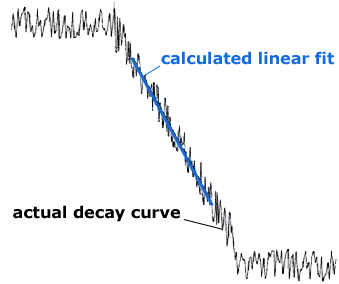
Reverberation Time is calculated using a linear least-squares regression of the actual measured decay curve. In simple terms, the calculation finds the straight line (linear fit) that best fits as a representation of all the measured data.
The XL2 automatically calculates two auxiliary results, correlation and uncertainty. These are both required by the standards, and indicate the precision of the results.
Correlation indicates how well the calculated linear fit matches to the actual decay curve. A high correlation value indicates a linear, non-distorted decay curve.
The correlation factor is expressed as a percentage; 100% represents perfectly linear sound pressure level decay after the sound source has ceased. The natural deviation from this linearity results in lower correlation values. Actual correlation factors are typically between 80 and 100%.
Uncertainty is introduced because pink noise is not a consistent signal, rather a random signal. It depends on the reverberation time (longer times produce lower uncertainty) and the bandwidth of the individual frequency band (broader bandwidth produces lower uncertainty). Also, lower bands show a higher uncertainty factor.
Uncertainty is influenced by the number of test cycles, the measurement method (T20 or T30), and the measurement filter (1/3rd or 1/1 octave resolution).
So, for a lower uncertainty (i.e. a better measurement accuracy),
T30 is better than T20
1/1 octave measurements are better than 1/3rd measurements
5 cycles is better than 3
(Note: a minimum of 3 cycles is required)
Use more measurement positions in the room
Where should I place the measurement microphone? Critical Distance Dc
It is recommended to place the sound source and the microphone in multiple positions, and average all the readings, to compensate, for example, for any room modes (resonances brought about by the dimensions of the room).
The microphone should always be placed at least 1 meter from reflecting surfaces (walls, doors, windows, floors, tables).
Further, there is a formula that helps us determine where to place the microphone relative to the sound source. It gives us the minimum distance required between any source of sound and the measurement microphone for a valid reverberation time measurement. This is known as the critical distance.

RT60 Critical Distance formula
Dc = critical distance [m]
V = Volume of the room [m3]
C = Speed of sound [m/s]
T = Expected Reverberation Time for the room [s]
Example: in a small hall, at a room temperature of 20℃, with dimensions of 10 meters by 9 meters and a height of 5 meters, and an expected Reverberation Time of 2 seconds, the microphone must be at least 1.6 meters away from the sound source.
V = 10 * 9 * 5 = 450 m3
C = 342 m/s (the speed of sound @ 20℃)
T = 2 seconds
Critical Distance Dc = 2 *√ (450 / (342 * 2)) = 1.6 meters
Shall I use 1/3rd or 1/1 octave frequency resolution?
The XL2 Acoustic Analyzer measures the Reverberation Time with 1/1 octave resolution, or, with the addition of the Extended Acoustic Pack Option, with 1/3rd octave resolution.
For many applications, using a 1/1 octave resolution is sufficient, unless the specification documentation with which you are working requires a 1/3rd octave resolution.
Shall I choose T20 or T30?
Typically, the ambient noise in a room (e.g. an apartment or office) would create a noise floor of 40-50 dB. To measure a decay of 60 dB from a sound source, we have to inject the sound at 75 dB (with 5 dB for the auto trigger and 10 dB headroom to the noise floor) above this noise floor. Creating such sound at 125 dB across the whole spectrum, and particularly at low frequencies, requires awfully high sound pressure and is often practically or even technically not feasible.
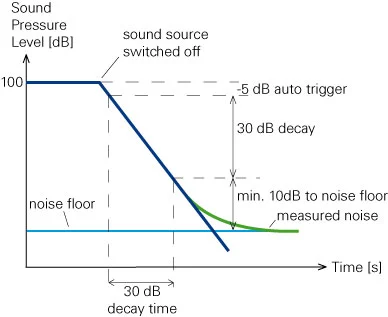
In practice, therefore, the standards ISO 3382-1 and ISO 3382-2 specify to measure the time taken for the reverberation to decay by 20 dB or 30 dB only. These readings can then be linearly extrapolated to a decay time of 60 dB.
- T20 = 3 * (time to decay by 20 dB) while
- T30 = 2 * (time to decay by 30 dB)
Generally, it is better to choose T30 over T20, as the measurement uncertainty will be lower. However, if the background noise is too high and/or the sound source is not loud enough to create an extra 45 dB, T20 may be your best option.
How do I get a single Reverberation Time result?
A single Reverberation Time result may be calculated by averaging measured values from a selection of frequency bands. For example, a single figure reverberation time may be calculated by averaging the results of the 500 Hz and 1000 Hz octave bands.
| Frequency [Hz] | Reverberation Time [s] |
|---|---|
| 63 | 0.90 |
| 125 | 0.87 |
| 250 | 0.76 |
| 500 | 0.67 |
| 1000 | 0.59 |
| 2000 | 0.56 |
| 4000 | 0.56 |
| 8000 | 0.51 |
(0.67 + 0.59) / 2 = 0.63
This result may be represented thus: T[500Hz, 1000Hz] = 0.63 seconds
Alternatively, for third-octave measurements, you may take averages over the six bands from 400 Hz to 1250 Hz.
| Frequency [Hz] | Reverberation Time [s] |
|---|---|
| 50 | 0.29 |
| 63 | 0.25 |
| 80 | 0.31 |
| 100 | 0.20 |
| 125 | 0.22 |
| 160 | 0.21 |
| 200 | 0.27 |
| 250 | 0.22 |
| 315 | 0.41 |
| 400 | 0.34 |
| 500 | 0.36 |
| 630 | 0.25 |
| 800 | 0.22 |
| 1000 | 0.23 |
| 1250 | 0.22 |
| 1600 | 0.22 |
| 2000 | 0.25 |
| 2500 | 0.21 |
| 3150 | 0.20 |
| 4000 | 0.22 |
| 5000 | 0.22 |
| 6300 | 0.21 |
| 8000 | 0.23 |
| 10000 | 0.22 |
(0.34 + 0.36 + 0.25 + 0.22 + 0.23 + 0.22) / 6 = 0.27
This result may be represented thus: T[400Hz-1.25kHz] = 0.27 seconds
According to the ISO 3382-1 standard, either of the above two results may be labelled Tmid.
Should I measure alone?
The process and the XL2 Acoustic Analyzer are designed to be operated by one person.
However, although it is loud and therefore possibly uncomfortable, there can be other people in the room during the measurement. It may, for example, be useful for you to have help moving the dodecahedron around.
Everyone in the room must remain still and quiet during measurements. They should all wear hearing protection. Avoid anyone standing near the microphone.
People who are present in the room during the measurement will absorb sound energy and possibly reduce the reverberation time value. You should document how many people were present during measurements.

How do I get a single Reverberation Time result?
A single Reverberation Time result may be calculated by averaging measured values from a selection of frequency bands. For example, a single figure reverberation time may be calculated by averaging the results of the 500 Hz and 1000 Hz octave bands.
| Frequency [Hz] | Reverberation Time [s] |
| 63 | 0.90 |
| 125 | 0.87 |
| 250 | 0.76 |
| 500 | 0.59 |
| 1000 | 0.67 |
| 2000 | 0.56 |
| 4000 | 0.56 |
| 8000 | 0.51 |
(0.67 + 0.59) / 2 = 0.63
This result may be represented thus: T[500Hz, 1000Hz] = 0.63 seconds
Alternatively, for third-octave measurements, you may take averages over the six bands from 400 Hz to 1250 Hz.
Sound Sources for Reverberation Time Measurement
Always wear hearing protection, as the sound sources for measurements can get loud.
Depending on the type and purpose of the room you are measuring, various sound sources are suitable.
In accordance with the ISO 3382 and ASTM E2235 standards, many common reverberation time measurements require an omnidirectional sound source, which means that the sound energy has to be distributed uniformly. For precise measurements, the sound source must have an omnidirectional radiation characteristic.
Dodecahedron Omnidirectional Speaker
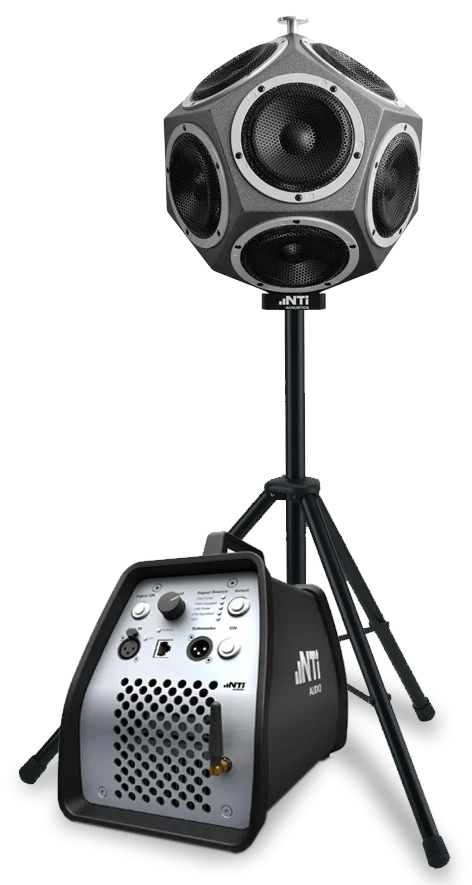
The DS3 Dodecahedron Speaker Kit offers a powerful omnidirectional sound source suitable for most applications, from small to relatively large rooms
Advantages
- lightweight for the 120.5 dB it delivers
- wireless remote control for mute/unmute
- the equalized pink noise covers the acoustic frequency spectrum from 100 Hz to 8 kHz
- low power compression ensures stable sound level over long time period
- re-useable at no expense
- meets all standards as it is not an impulsive sound source

δ-Clapper
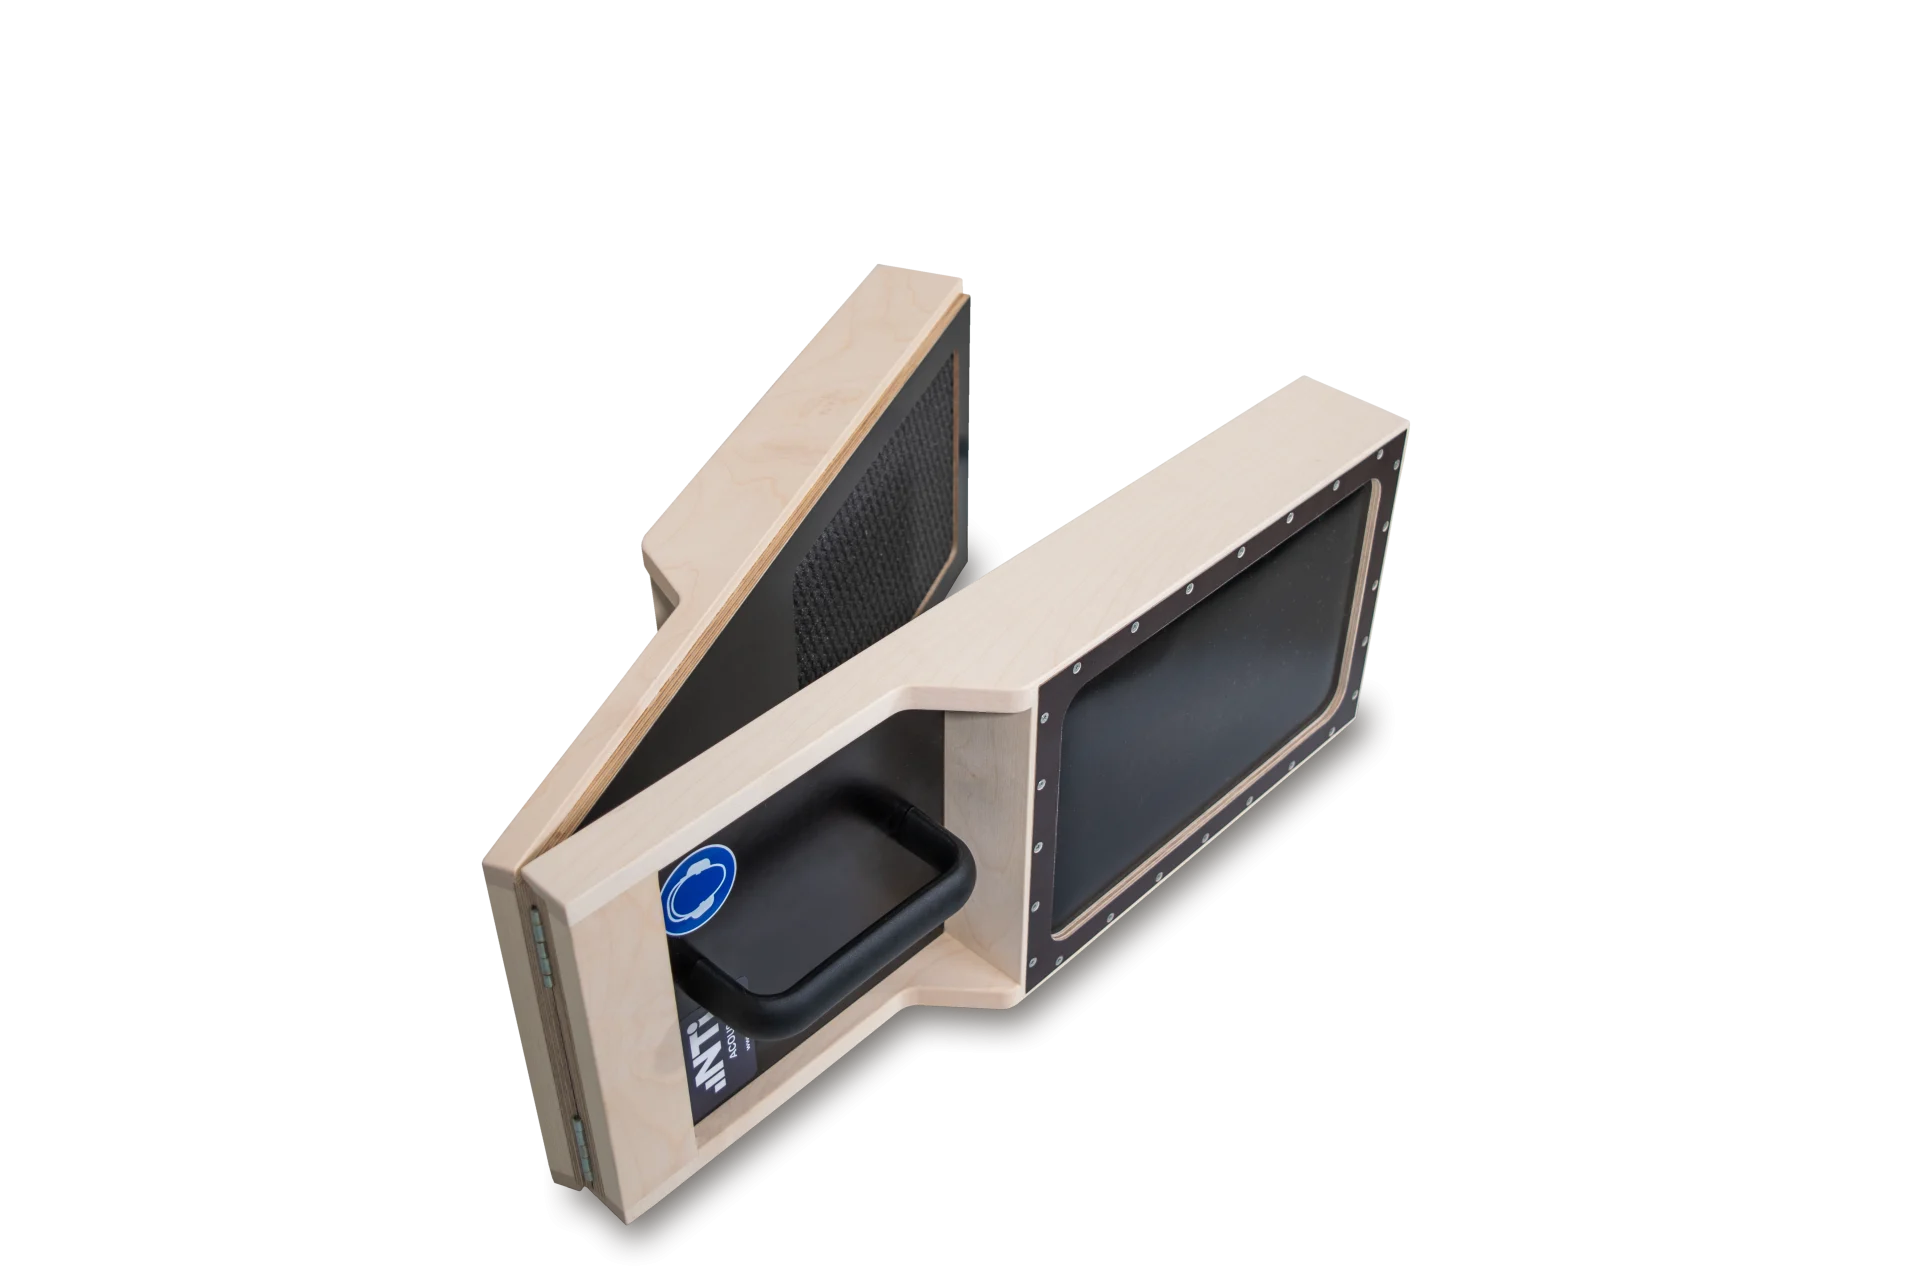
The δ-Clapper (called delta-Clapper) is a practical impulsive source for measuring reverberation time RT in rooms. It allows multiple measurements to be carried out quickly and easily.
Advantages
- easy to carry around
- no setup
- re-useable at no expense
Disadvantages
- the δ-clapper sound may not cover the whole measurement frequency range
- the δ-clapper may not create sufficient noise energy in larger rooms
- does not meet the ASTM E2235 standard as it is an impulsive sound source

