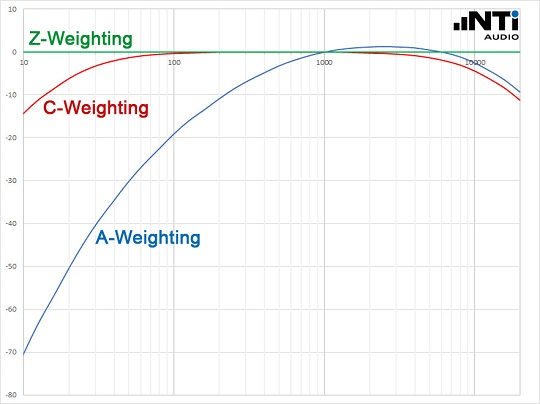
Certified sound level meters offer noise measurements with A, C and Z frequency weighting. So what is the difference?
If a sound is produced with equal sound pressure across the whole frequency spectrum, it could be represented in the graph below by the Z-Weighting line. What humans are physically capable of hearing is represented by the A-Weighting curve. Acoustic sound contains more lower and higher frequencies than humans perceive. The C-Weighting curve represents what humans hear when the sound is turned up; we become more sensitive to the lower frequencies. The A and C weightings are thus most meaningful for describing the frequency response of the human ear toward real world sounds.

As acoustic sound level measurements are often motivated by the effect of sounds on humans, the A-weighting filter is commonly applied. The C-weighting filter is often applied when representing peak levels. The Z-Weighting (no weighting and thus no filter) may be applied, for example, where an analysis of the sound source is required rather than the effect the sound has on humans, such as in testing the frequency response of produced loudspeakers in a manufacturing process.
Frequency weightings are used when describing sound levels. For example, maximum noise levels at work, as recommended by the World Health Organization (WHO), are LAeq = 85 dB and LCpeak = 135 dB. The letters A and C indicate which frequency weighting filter should be applied to the measured sound.
The following are the spectral weighting adjustment factors to apply when converting between the weightings, in accordance with the IEC61672:2014 standard:
1/3 Octave Band Weighting Factors
| 6.3 |
-85.4 |
-21.3 |
0.0 |
| 8 |
-77.8 |
-17.7 |
0.0 |
| 10 |
-70.4 |
-14.3 |
0.0 |
| 12.5 |
-63.4 |
-11.2 |
0.0 |
| 16 |
-56.7 |
-8.5 |
0.0 |
| 20 |
-50.5 |
-6.2 |
0.0 |
| 25 |
-44.7 |
-4.4 |
0.0 |
| 31.5 |
-39.4 |
-3.0 |
0.0 |
| 40 |
-34.6 |
-2.0 |
0.0 |
| 50 |
-30.2 |
-1.3 |
0.0 |
| 63 |
-26.2 |
-0.8 |
0.0 |
| 80 |
-22.5 |
-0.5 |
0.0 |
| 100 |
-19.1 |
-0.3 |
0.0 |
| 125 |
-16.1 |
-0.2 |
0.0 |
| 160 |
-13.4 |
-0.1 |
0.0 |
| 200 |
-10.9 |
0.0 |
0.0 |
| 250 |
-8.6 |
0.0 |
0.0 |
| 315 |
-6.6 |
0.0 |
0.0 |
| 400 |
-4.8 |
0.0 |
0.0 |
| 500 |
-3.2 |
0.0 |
0.0 |
| 630 |
-1.9 |
0.0 |
0.0 |
| 800 |
-0.8 |
0.0 |
0.0 |
| 1000 |
0 |
0 |
0 |
| 1250 |
0.6 |
0.0 |
0.0 |
| 1600 |
1.0 |
-0.1 |
0.0 |
| 2000 |
1.2 |
-0.2 |
0.0 |
| 2500 |
1.3 |
-0.3 |
0.0 |
| 3150 |
1.2 |
-0.5 |
0.0 |
| 4000 |
1.0 |
-0.8 |
0.0 |
| 5000 |
0.5 |
-1.3 |
0.0 |
| 6300 |
-0.1 |
-2.0 |
0.0 |
| 8000 |
-1.1 |
-3.0 |
0.0 |
| 10000 |
-2.5 |
-4.4 |
0.0 |
| 12500 |
-4.3 |
-6.2 |
0.0 |
| 16000 |
-6.6 |
-8.5 |
0.0 |
| 20000 |
-9.3 |
-11.2 |
0.0 |
Octave Band Weighting Factors
| 8 |
-77.8 |
-17.7 |
0.0 |
| 16 |
-56.7 |
-8.5 |
0.0 |
| 31.5 |
-39.4 |
-3.0 |
0.0 |
| 63 |
-26.2 |
-0.8 |
0.0 |
| 125 |
-16.1 |
-0.2 |
0.0 |
| 250 |
-8.6 |
0.0 |
0.0 |
| 500 |
-3.2 |
0.0 |
0.0 |
| 1000 |
0 |
0 |
0 |
| 2000 |
1.2 |
-0.2 |
0.0 |
| 4000 |
1.0 |
-0.8 |
0.0 |
| 8000 |
-1.1 |
-3.0 |
0.0 |
| 16000 |
-6.6 |
-8.5 |
0.0 |