What are LAeq and LAFmax?
LAeq and LAFmax are a couple of the many indicators used to describe sound and noise level values. Here is a basic explanation of the most commonly-used of these indicators in audio and acoustic measurement.
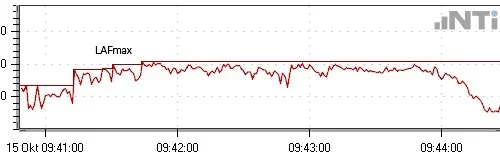
As an example we’ll look at the indicator LAFmax
Level
Beginning on the left, the first letter is a capital “L”.
For indicators, the first letter is always an “L”. This simply stands for “Level”, as in the sound pressure level (acoustic) measured through a microphone or the signal level (audio) measured at the output from an audio component, such as a mixing desk.
Audio versus Acoustic
The word “acoustic” is used in this article to refer to sound that travels through air. The word “audio” is used to refer to sound that travels electronically through cables and audio components.
Frequency Weighting
The second letter in our example is the capital letter “A”.
For indicators, the second letter is commonly “A”, “C” or “Z”. This is called the “frequency weighting” and indicates that some frequencies within the audio spectrum are, in some cases, given a weighting. i.e. the level of these frequencies is reduced or increased in the measurement.
The reason for these reductions at lower and higher frequencies has to do with our hearing ability. Humans are better at hearing mid-range frequencies than high or low frequencies. The following three sound samples demonstrate this. Each of these samples is recorded with the same level. Yet when you play them, you may perceive that the low (125 Hz) and the high (10 kHz) are softer. Older people may not even be able to hear the 10 kHz signal; with age people lose their ability to hear high frequencies.
0:00 /0:00 0:00 /0:00 0:00 /0:00
Caution: There are many things that can influence your perception of loudness; high-frequency sounds may be more annoying and may thus appear louder, sound reflecting on surfaces (such as your table) may make low frequencies sound louder, size and/or quality of the loudspeakers may compromise low and high frequencies, your system may compress the signal if you play back too loud. Taking all these things into account, to experience the A-Weighting effect, we further recommend that you rather play these files softly through speakers, not headphones!
If we were to play these three samples through one of the channels of an audio mixing desk, because, for example, we wanted to test how the channel responds to each frequency, then we would measure the frequency response of the channel using an audio analyzer without frequency weighting. In other words, all frequencies are treated equally (“Z” = no frequency weighting).
If we were then to play these three samples through a loudspeaker to test how the speaker will be heard by humans, we want to reduce the high and low frequencies measured by the sound level meter so as to represent what humans hear. In this case we apply an “A” weighting to the frequencies. In our example, we would then measure LAFmax.
When sound levels get loud (above 100 dB), humans become more sensitive to both the high and the low frequencies. To represent this in a sound level meter measurement, we apply the “C” frequency weighting. In our example, we would then measure LCFmax.
In summary, the basic rule for frequency weighting is, use “Z” for all audio measurements and acoustic measurements where you do not want to consider the human hearing perception, such as testing the response of a loudspeaker across the entire frequency range. Use “A” for all acoustic measurements under 100 dB. Where sound levels are above 100 dB, use “C”.
Consequently, the options for frequency weighting are LZ, LA and LC
Time Weighting
The third letter in our example is the capital letter “F”.
The third letter is often “F”, “S” or “I”. This is called the “time weighting”. F = Fast, S = Slow, I = Impulse. Historically, the time weighting was applied so that levels measured were easier to read on a sound level meter. The time weighting dampens sudden changes in levels, thus creating a smoother display.
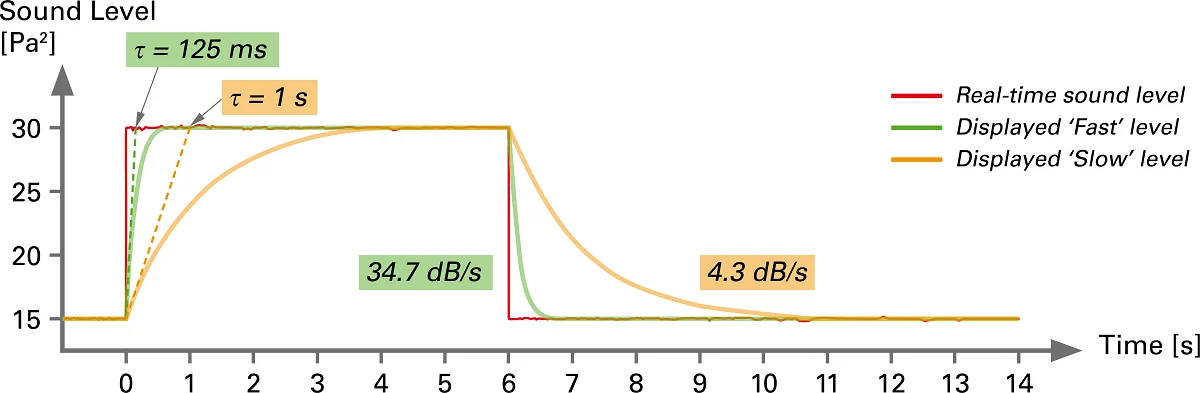
The graph below indicates how this works. In this example, the input signal suddenly increases from 50 dB to 80 dB, stays there for 6 seconds, then disappears just as suddenly.
An LAF measurement (green line) will take approximately 0.6 seconds (attack time) to reach 80 dB and just under 1 second (decay time) to drop back down to 50 dB.
An LAS measurement (yellow line) is slower to react. It will take approximately 5 seconds to reach 80 dB and around 6 seconds to drop back down to 50 dB.
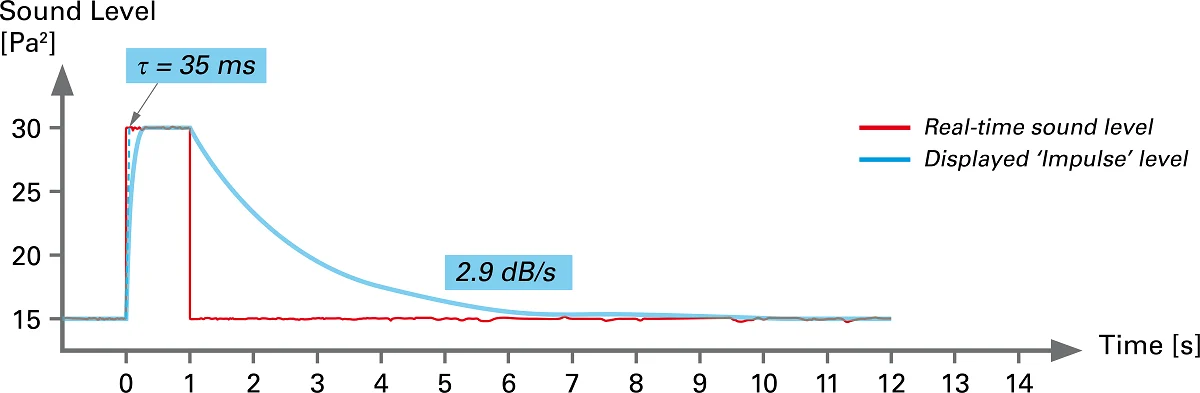
An LAI measurement (blue line) will take approximately 0.3 seconds to reach 80 dB and over 9 seconds to drop back down to 50 dB.
What do τ = 1 s, 125 ms or 35 ms represent?
The line described is exponential in the attack and linear in the decay. The initial tangent of the attack dissects the new level, in this case 80 dB, at specific intervals from the initial impulse. These are 1 second for Slow, 125 ms for Fast and 35 ms for Impulse.
F, S or I – which do I choose?
When measuring averages, “S” may be appropriate when measuring a signal that oscillates very quickly. “F” may be more suitable where the signal is less impulsive. The decision to use Fast or Slow is often reached by what is prescribed in a standard or a law.
The impulse weighting, “I” can be used in situations where there are sharp impulsive noises, such as when measuring fireworks or gun shots.
In our example, the options for time weighting are LAF, LAS and LAI
max & min
The word “max” makes up the rest of the indicator.
This is simply the maximum value measured over a certain period of time. Similarly, “min” gives us the minimum value.
LAeq
Another common indicator used is LAeq
The equivalent (“eq”) sound level corresponds to the average received sound energy over time, and is easier to read on a display than the instantaneous sound level.
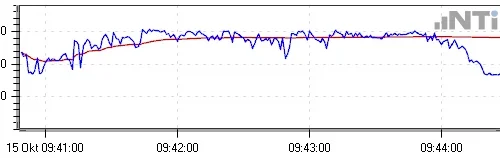
If you look at the following graph of sound level over time, the area under the blue curve represents the energy. The horizontal red line drawn to represent the same area under the blue curve, gives us the LAeq. That is the equivalent value or average of the energy over the entire graph.
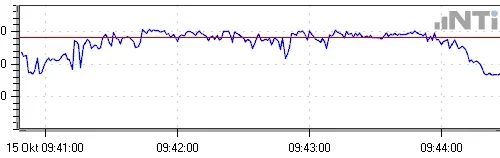
LAeq is not always a straight line. If the LAeq is recorded over time – i.e. plotted as the equivalent from the beginning of the graph to each of the measurement points – the plot looks like this.