How are Percentile Statistics measured?
Statistical noise levels LN are commonly used for environmental noise monitoring, such as road traffic or community noise assessments. In these applications, noise levels fluctuate significantly over time, and level statistics help to better understand what’s going on.
For example, L90 describes the level which was exceeded for 90% of the time. That is, for 90% of the time for the period measured, the noise level was at least above the L90 level. The L90 level is often used as an approximation of the background noise level. On the other side of the scale, L01 describes the level which was exceeded for only 1% of the time. That is, for 1% of the time for the period measured, the noise level was at least above the L01 level. The L01 level is sometimes used as an approximation of the maximum level Lmax.
To demonstrate visually how LN values are calculated, the following chart explains the L10 level.
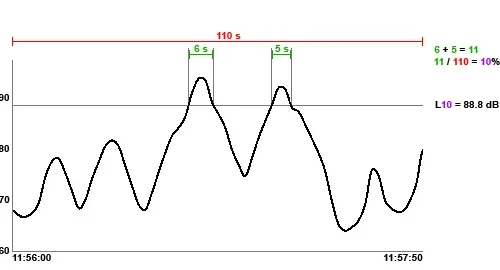
Statistical noise level L10
How does the XL2 measure statistics?
The XL2 samples the selected input values once every millisecond and stores each result. To optimize the memory required to store this much data, values are rounded (e.g. to 1 dB) and then only the number of occurrences of a certain value is stored (and not the value itself). The memory which stores the occurrence is called the “class” and the rounding of the input value the “class width”.
The measured parameter used to calculate statistics has to be chosen before the measurement has been started, e.g. LAF or LAeq, and cannot be changed afterward. The choice of Level Statistic Ln (e.g. L33 instead of L90) may be changed even after the measurement has been finished.
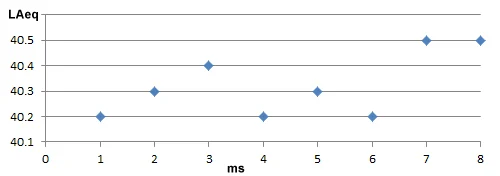
Measured levels every millisecond (ms)
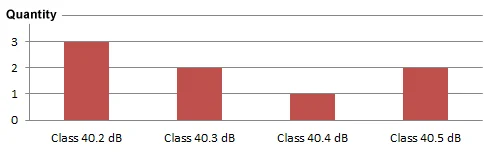
Number of occurrences
Wideband Level Statistics
Here, the XL2 samples the input value once every millisecond into 0.1 dB width classes. The measured broadband parameters LxS, LxF and LxEQ1″ may be selected for statistical calculations (x = A/C/Z) using the “Set EQT, L% page” of the SLMeter function.
Spectral Level Statistics (1/1 or 1/3 octave band)
The parameter shown in the live RTA screen is the one used as the input parameter for the level statistics. Each RTA band has its own statistical distribution used to calculate any LN values. To limit the memory requirements the class width here is set to 1 dB. The percentile results start at whole numbers using firmware V4.32 onwards. Older firmware versions use the same digit after the comma, which depends on the microphone sensitivity.
How does the XL2 log level statistics?
LN values may also be chosen to be logged in the XL2. The LN results calculated are the overall values since the start of the measurement. A logged LN value will show how the final overall values or total LN value have evolved during the measurement period, but will not show a separate statistical result for each log interval. To record distinct LN values for specific measurement periods, say every 5 minutes, the repeated timer mode should be used. This stores the distinct LN values in the sound level meter report file.
Post calculation with XL2 Data Explorer Software
The XL2 Data Explorer PC-Software offers a detailed statistical analysis of the logged sound level measurement data. Often LN values based on LAF values are required. Therefore we recommend selecting a 100 ms logging interval and to add LAFmax to the list of selected logged values to be stored on the XL2. This provides the LAFmax of every 100 ms for the statistical calculation.
The analysis is based on the actual logged sound levels and is thus independent of any statistical results calculated within XL2 measurement reports. This allows the Data Explorer to recalculate LN results, where markers or excluded areas have been identified, as part of the post-measurement analysis. The LN results produced by Data Explorer and the LN values calculated by the XL2 may differ marginally as the Data Explorer uses the 100 ms logged data while the XL2 uses the higher-resolution raw data sampled at 1 ms intervals.
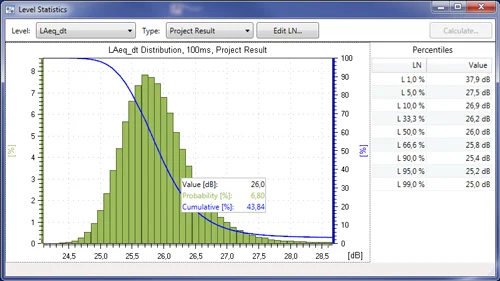
Level Statistics Screenshot of XL2 Data Explorer Software
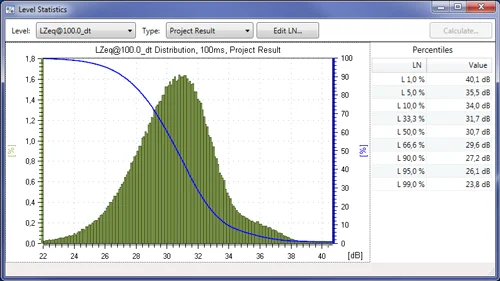
Level Statistics of 100 Hz Band (Screenshot of XL2 Data Explorer Software)